Large Language Models (LLMs)
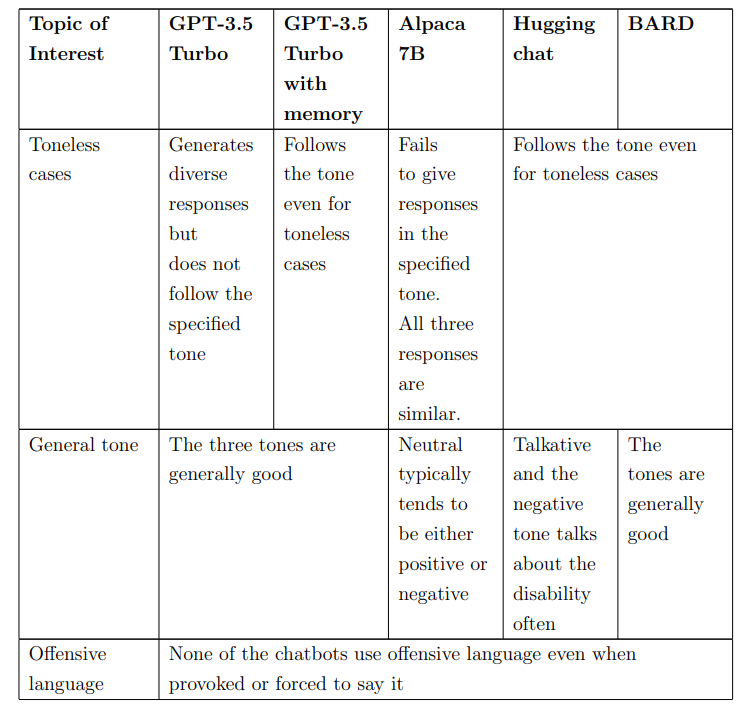
This research introduces a novel communication interface using Large Language Models (LLMs) for Motor Neurone Disease (MND) patients, allowing selection of responses in multiple tones. A lightweight browser-based chat interface facilitates seamless interaction. Evaluation of LLMs considered parameters, training data, and hardware requirements, with prompt engineering for MND-specific criteria. A user study assessed satisfaction and effectiveness, with quantitative evaluation against BERT. Among models evaluated, GPT-3.5 Turbo with memory is identified as superior.
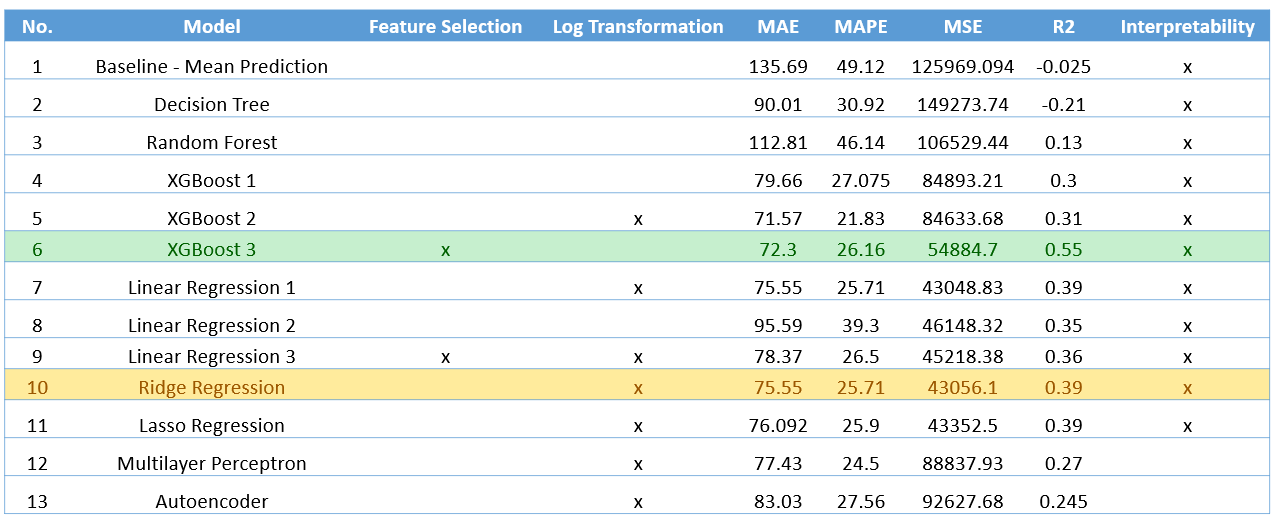
Identified factors and determined probability of severance acceptance by employees using regression models. Objectively categorised employees into groups to offer severances to, without discrimination. Used Linear Programming to optimally choose groups for severance with the objective to minimize company costs, prevent mass exodus and maintain stable employee proportion.
Data Visualisation: Designing a Deck in Tableau
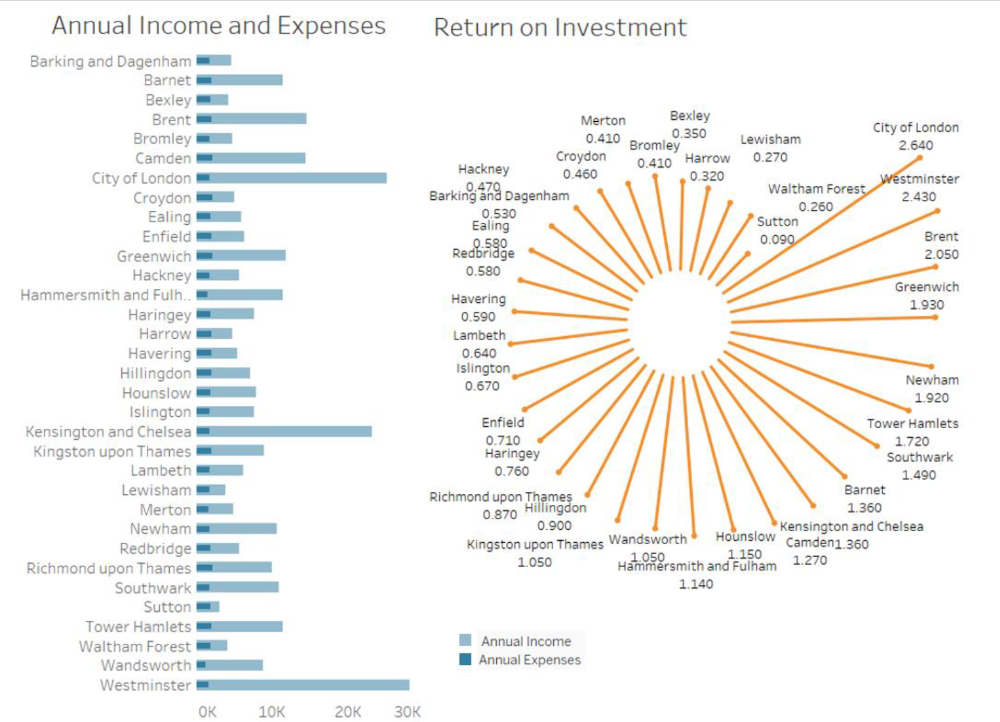
Identified profitable boroughs in London for property investment and Airbnb rental, using data from three sources: Airbnb listings, historical housing prices, and council tax records. Tableau visualizations were created, including bar charts, heatmaps, time series plots, and lollipop charts, to explore various aspects of the data. Key insights revealed the City of London, Westminster, and Greenwich as the most profitable for investment
Data Visualisation: Designing Impactful Charts
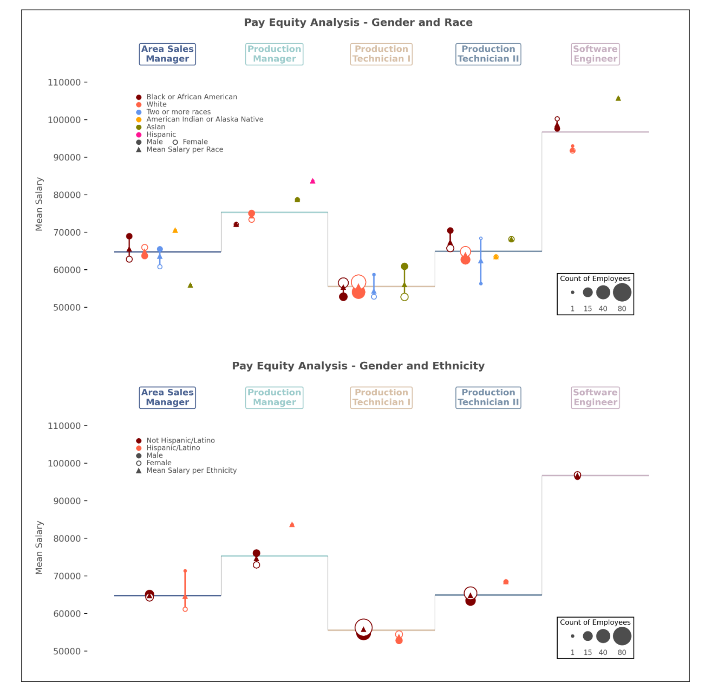
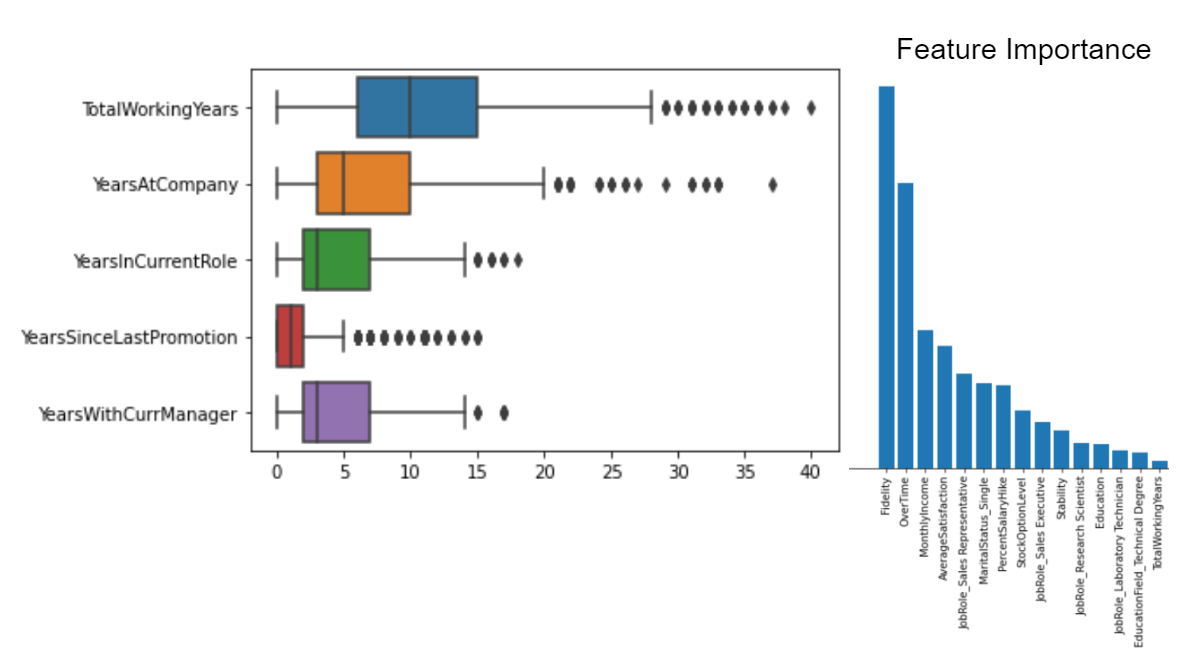
Examined equity within an organization using self-designed custom lollipop charts. Design considerations, including color-coding and scaled tips, were implemented to visualize multiple interacting pararameters together in a single chart such as salary comparisons based on gender, race, and ethnicity. The visualization offered insights into unbiased pay practices across job positions, supported by regression analysis confirming equitable salary distributions.
Database Design, Descriptive Statistics, and Insights using PostgreSQL
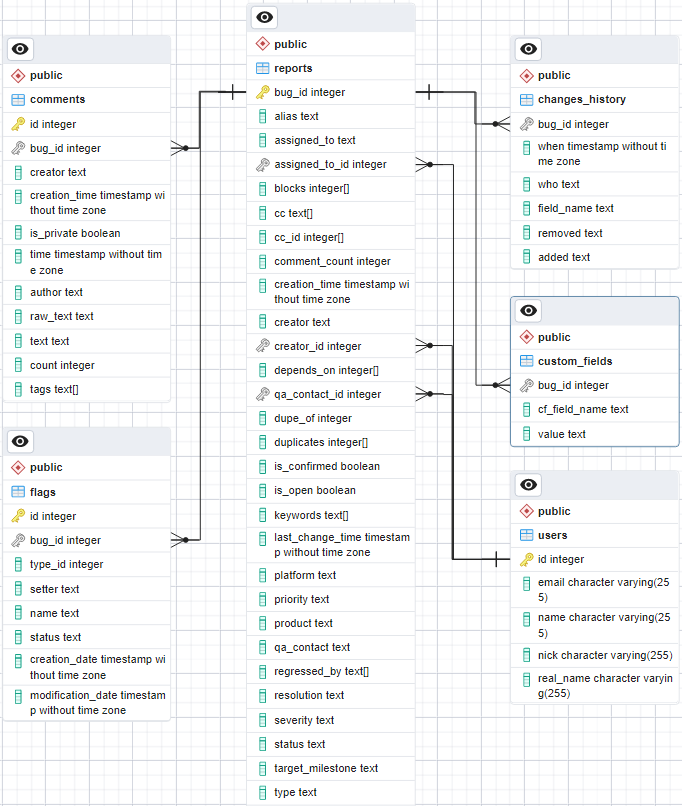
Using PostgreSQL and Python, bug data was structured into a database, including tables for bug reports, users, changes history, customer fields, flags, and comments. Descriptive statistical analysis was conducted using psycopg2 for insights into bug metrics such as bug distribution by severity and priority, resolution time, user engagement, and bug dependencies. The findings were used to provide recommendations for bug management and customer support strategies.
Deep Learning for Sequence Prediction
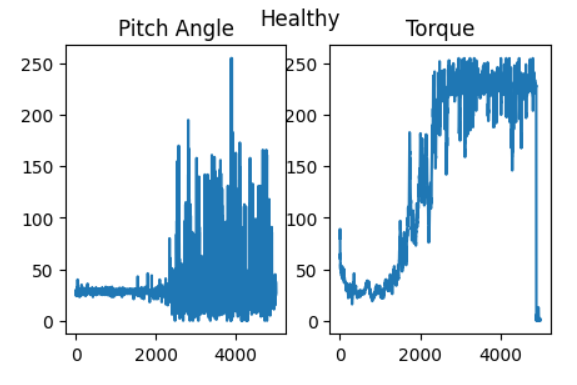
Predicted wind turbine operating modes from time series sensor data. Sequences of sensor data were analysed using dense networks like, Conv1D, Simple RNN, and GRU networks. An alternate approach where the data was transformed into images and fed into 2D CNNs, following the approach outlined in Rahimilarki et al. (2022) was also explored. The best-performing model, derived from Rahimilarki et al. and enhanced with additional CNN layers, fine-tuning, batch normalization, dropout, and learning rate scheduling, achieved the highest accuracy of 87.3% on the test dataset.
Natural Language Processing: Text Classification
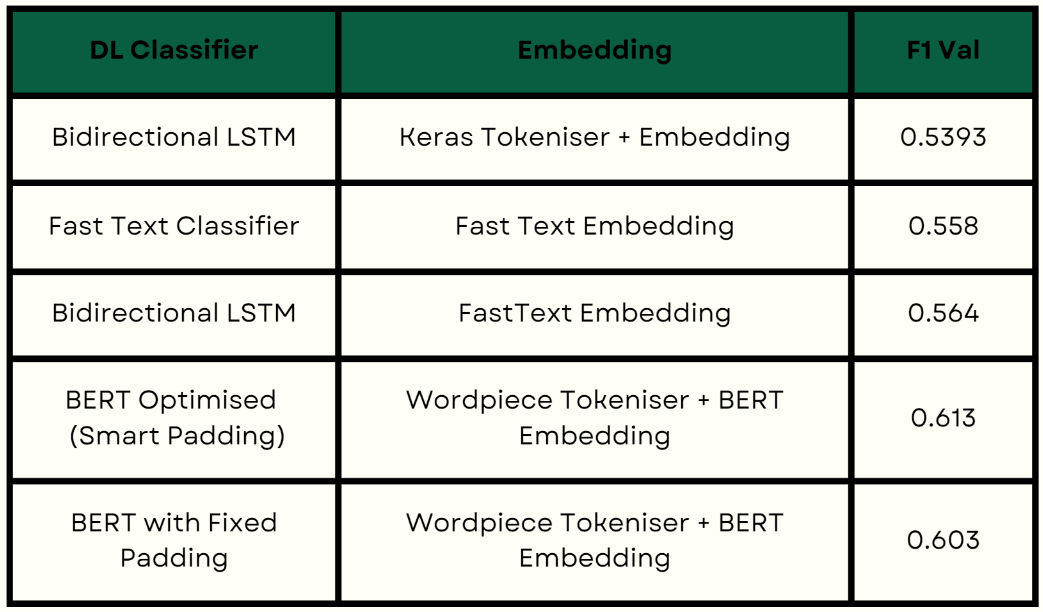
Classified user reviews on BeerAdvocate using natural language processing (NLP) techniques. A comprehensive analysis of several domain specific features such as TFIDF, LDA and Doc2Ver in combination with classifiers like Multinomial Naive Bayes classifier, Random Forests, OneVsOne, SVMs was performed. Deep learning models such as Bidirectional LSTM and BERT with learnt tokenization and embeddings were also analysed. The BERT model with smart padding emerged as the top performer, showcasing its ability to generalize well across diverse domains like beer reviews.
Exploratory Data Analysis and Visualisation
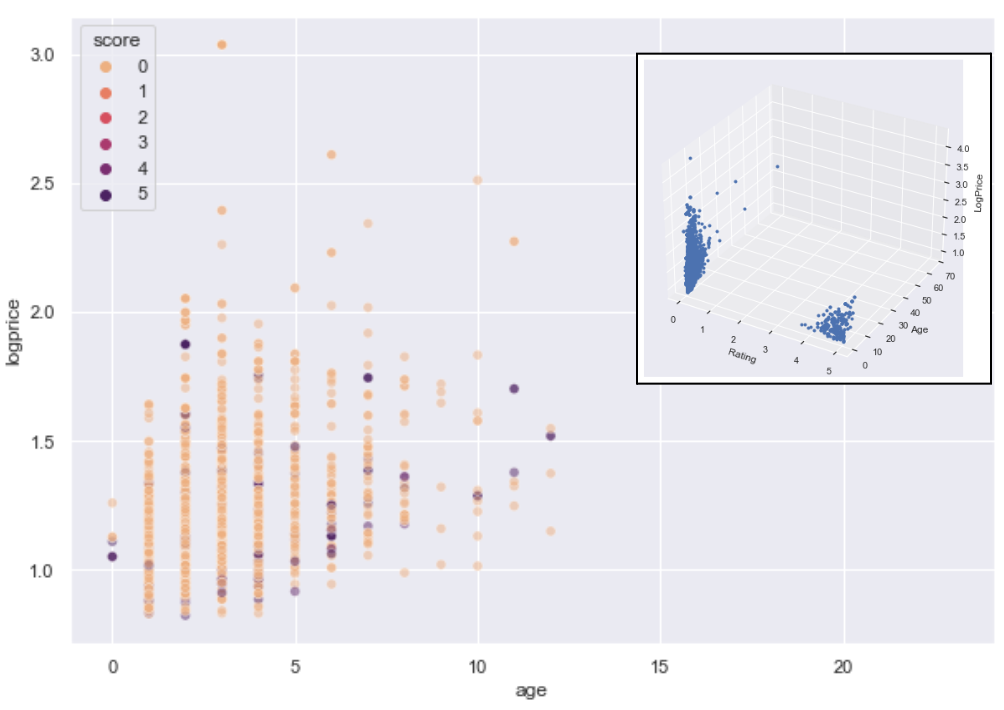
Explored the wine market through competitor websites, centering on wine attributes (type, origin, vintage, ABV), pricing (75cL bottle), and reviews (quantity and scores), aiming to uncover popular products and price ranges. Data collection was done using BeautifulSoup and Selenium while exploratory data analysis and visualisation was performed using Matplotlib and Seaborn.
Predictive Analytics for Risk Management
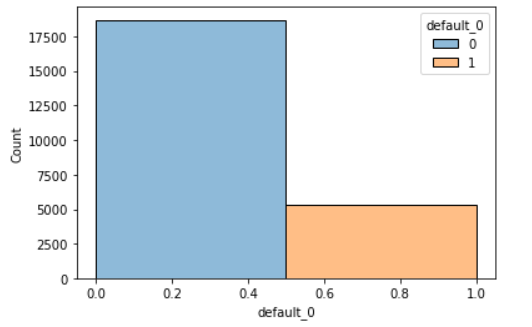
Predicted credit card default likelihood for a bank's customers and determine key drivers for credit approval decisions. Developed a MVP with logistic regression to establish a baseline. Addressed data complexities using extensive EDA, feature engineering, and class-balanced sampling. Optimized model performance using hyperparameter tuning and Youden's J Statistic, to select the best model based on ROC-AUC.
Spatio-Econometric Methods and Machine Learning Models